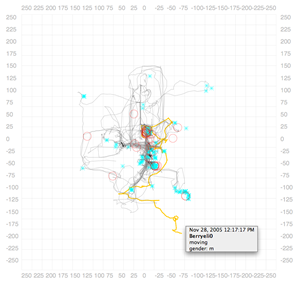
Hovering on symbols highlights them. In addition, all other symbols related to that entity are selected. For example, here lines are used to show trails of avatars (i.e. how they moved in the virtual world). Hovering over any part of the trail highlights the whole trail.
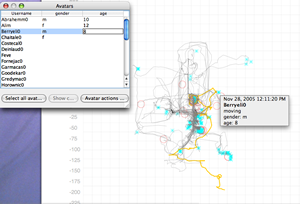
Every avatar can be annotated with arbitrary data. You can add additional columns and add more data. As you annotate, data is automatically saved and instantly reflected in the visualization.
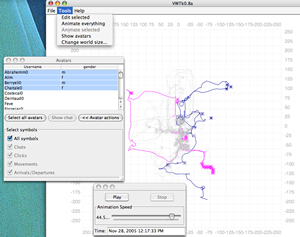
Here's an example where VWTk is very useful. After adding annotations, you can select subsets of avatars and change their visual attributes. Here males are set to blue and females to pink (thus enforcing the gender stereotype in the process ;). Then the animation tool is used to replay how the avatars moved through space allowing you to instantly examine differences in the way males and females moved in space. Rest of the symbols have been set to light grey to provide context and ensure that they don't interfere with the objects under study.
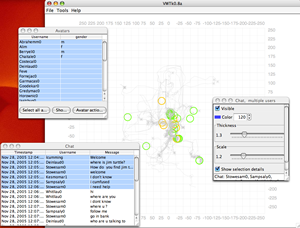
Chats are shown here using circles. The entire chat transcript is available to you. As you scroll down the chat table, the corresponding symbol is highlighted. This allows you to quickly see where and when the avatars of interest talked with respect to the others.
